Simonis and the Simeonite Spine: Ancient I Hardware from the Sephardic Diaspora to the Ashkenazi I-Z140 Lineage
- Weston Simonis
- Mar 8
- 43 min read

Updated: Mar 10

Ancient I Hardware, the Ashkenazi I-Z140 Scaffold, and the Simeonite Spine
The more ancient, regional, autosomal, and Y-chromosomal data that are placed on the table, the less credible it becomes to reduce the I-CTS10937 / I-Y12047 spine to a late “Northern European accident.” The hardware itself points elsewhere. It points to a wider Near-Eastern and Mediterranean world that later flows through Anatolia, the Levant, Egypt, Yemen, Morocco, Sicily, Iberia, the African Corridor, the Balkans, Romania, the Netherlands, and the Ashkenazi north. What modern databases often present as a northern line is better understood as a southern and eastern trunk preserved in northern testing fields.
This is where the structure of the argument begins. On the Y-chromosome, the paternal spine runs through I-Z2535 → I-CTS10937 → I-Y3153 → I-Y12047. On the autosomal side, the genome repeatedly expresses East Mediterranean, West Mediterranean, Anatolian, Caucasus, West Asian, North African, Sephardic Jewish, Moroccan Jewish, Romanian Jewish, Iraqi Jewish, Yemenite Jewish, Georgian Jewish, Azerbaijani Jewish, Uzbek Jewish, Indian Jewish, and Ashkenazi Jewish segments across multiple chromosomes. On the historical side, the surname Simonis surfaces in Sicilian Jewish settings, then later in Sephardic and converso corridors, then in the Low Countries, and finally in Ashkenazi communities broken by the Shoah. These are not separate stories. They are one line of bone and blood.
The Oldest Estates: Neolithic Anatolia and the Southern Trunk
Ancient DNA from Neolithic Anatolia, around 6500–6000 BCE, already places the early farming world inside a connected southern zone rather than a closed northern one. Haplogroup G2a appears as the dominant farmer lineage, but I-branches are also present within that same Fertile Crescent horizon. That matters because it places the broader I-trunk inside the Near-Eastern and Anatolian estate more than eight thousand years ago. The line was already present in the old southern world; it was not a medieval tourist wandering down from Germany.
Those Anatolian farmer populations later fed strongly into Mediterranean and southern European populations. Their profile aligns especially well with later Sardinian and southern Italian continuity, which resonates with the heavy West Mediterranean load visible in the autosomal profile here. In this framework, these Anatolian I-carriers represent the oldest estates of the I-trunk: early southern plots from which later branches such as I-CTS10937 and I-Y12047 can be understood to grow.
That reading fits the chromosomal evidence. The Mediterranean layer is not occasional in the genome. It appears repeatedly across the chromosomes in multiple forms: East Mediterranean, West Mediterranean, Anatolian, Caucasus, and West Asian. These are not decorative side notes. They are the genome-wide southern foundation.
Egypt, Morocco, and the African Arc
The southern hardware does not stop in Anatolia. It continues into the Nile Valley and North Africa, forming what may be called the African Arc of the same older world.
In Egypt, an Old Kingdom elite individual anchors a high-status genome within a largely North-African / West-Asian / Levantine interaction sphere. Even where the precise paternal line is not the same branch under discussion, the broader point remains: Egypt belongs to the same southern network in which Mediterranean and Levantine lineages circulated long before modern national labels existed. Egypt is not outside the corridor. It is one of its major hinges.
Morocco shows the same pattern from the western side. Ancient Moroccan Neolithic and Late Neolithic genomes reveal a mixture of endemic Maghrebi ancestry with Near-Eastern and European-farmer components. That is the same broad southern package that carried lineages along the Mediterranean coast. In modern Moroccan Y-data, haplogroup I remains statistically rare beside dominant North-African clades, yet its very presence is enough to show that the I-trunk is not absent from the Maghreb. It survives there as a faint hardware echo of the wider southern trunk.


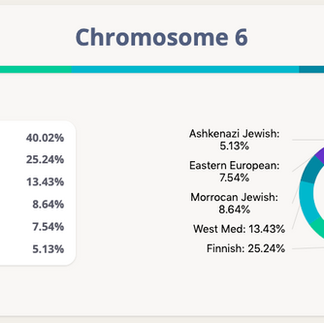


The autosomal profile mirrors that arc. Moroccan Jewish appears repeatedly and not as a one-off curiosity. It appears strongly on chromosome 6, chromosome 14, chromosome 17, chromosome 20, and chromosome 21. This western North-African Jewish layer sits beside repeated West Mediterranean structure, making the Maghreb a real part of the genome-wide field rather than a remote comparison population.
Sidon, Ashkelon, and the Simeon Belt
The southern Levant provides the most important middle section of the spine. Bronze-Age Sidon and Iron-Age Ashkelon do not present an exhaustive census of every Y-line in the Levant. They present a sampled window into a much larger Canaanite and coastal world. Sidon reveals a Canaanite-related autosomal continuity stream that later contributes to both modern Levantine and Jewish populations. With only a handful of male lines sampled, that material cannot exhaust every paternal branch that moved within the land.
That is where the I-CTS10937 / I-Y12047 corridor fits. It falls into the unsampled or under-sampled hardware zones of that same wider Canaanite world. The line does not stand outside Levantine continuity. It belongs in the statistical blind spots of a tiny ancient sample base.
Ashkelon sharpens the point further. The early Iron-Age coastal zone already shows Mediterranean-linked admixture entering the southern Levant. That means the very belt associated with Philistine–Simeonite coastal interaction was already a mixed Mediterranean–Levantine contact zone. The geography itself fits the structure of the line: a southern house in a corridor that connected the Levant with the wider Mediterranean.

In that framework, the rare DYS455 = 8 marker becomes a crucial piece of hardware language. Shared between the I-Y12047 corridor and related lines in Hebron and Jordan, this rare slow marker functions as a kind of serial number: not a tourist mark, but a durable trace linking the paternal spine into the land belt traditionally associated with Simeon.
Ashkenazi Clusters on the I-Z140 Scaffold
Independent Jewish DNA projects and Y-DNA surname studies now openly recognize Ashkenazi founder clusters inside haplogroup I, especially on the I-Z140 and CTS10937 branches. On their public trees, one sees groups of men labeled as Ashkenazi lines sharing the same I-subclades, the same Central- and Eastern-European geography, and common ancestors dated to the late first millennium and medieval period. Those dates and locations align with the classic Ashkenazi population expansion. These are not random outliers. They are part of the Ashkenazi paternal structure itself.
This is why the I-Z2535 → CTS10937 → Y3153 → Y12047 corridor matters so much. It grows out of the same I-Z140 scaffold that outside Jewish DNA projects already use to house clearly Ashkenazi I-lines. In other words, the Simeonite scaffold is not a private theory floating without support. It is plugged directly into an I-backbone that Jewish DNA sites themselves map as Ashkenazi territory.
That also reframes the line properly. It is not a purely northern branch with an inexplicable Jewish overlay. It is a branch sitting on a scaffold already occupied by documented Jewish founder clusters, especially in the Ashkenazi world.
The Iberian Converso Corridor Upstream of I-Y12047
Before the Simonis line reaches its present position at I-Y12047, the Y-DNA tree already reveals a striking social pattern forming upstream along the same branch. The corridor running through I-Z2535 → I-CTS10937 → I-Y3153 is not populated primarily by northern European surnames. Instead, it is crowded with Iberian and converso-associated names, many historically tied to Sephardic Jewish families who moved through Spain, Portugal, the Azores, and the Atlantic world following the expulsions of the late fifteenth century.
Within the broader I-Z140 → CTS10937 framework, clusters of testers carry surnames deeply rooted in the Iberian world. These include names such as Garcia, Chavez, Vallejos, Lujan, Gurule, Torres, Castells, Anguiano, Baca, Hernandez, Lozada, Sanchez, and Alvarez, alongside Portuguese and Azorean lines such as Gomes, Dutra, Simas Melo, Aleixo, de Macedo Soares, and Goulart.
Many of these surnames appear repeatedly in historical records tied to converso and New Christian families—Jewish households forced into baptism during the Spanish and Portuguese expulsions but who often preserved elements of their identity through family networks, trade routes, and marriage patterns. The presence of these surnames clustered along the CTS10937 → Y3153 corridor suggests that the branch itself became embedded within the same social environment that produced the Sephardic diaspora.
Geographically, the pattern mirrors the known routes of Sephardic dispersal. The surnames appear not only in Spain and Portugal, but also in the Azores, the Caribbean, New Mexico, Colombia, and other Atlantic settlements tied to Iberian migration. Interwoven among them are surnames from England, Scotland, Scandinavia, and the Netherlands, reflecting the northern ports where Sephardic merchants and converso families established communities during the sixteenth and seventeenth centuries.
This makes the upstream structure of I-Y12047 particularly significant. The branch does not arise in a purely northern European environment. It emerges from a corridor already saturated with Iberian, Sephardic, and converso surnames.
When the Simonis line is placed within that framework, the later historical record begins to align naturally with the genetic tree. The surname appears first in Sicilian Jewish communities, then in the Sephardic crisis of 1492–1497, then again in the Low Countries, and eventually within Ashkenazi Europe. The genetic corridor surrounding I-Y12047 mirrors that same movement.
Rather than a northern European line that later acquired Jewish connections, the structure of the tree suggests something different: a branch whose immediate neighborhood was already embedded within the Iberian Sephardic and converso world before it reached the later Ashkenazi expansion zones of Central and Eastern Europe.
I-Y12047: Where Sephardic Conversos Meet the Ashkenazi I Trunk
On paper, the Y-chromosome may look simple: I-Z2535 → I-CTS10937 → I-Y3153 → I-Y12047, with CTS10937 formed in the Middle–Late Bronze Age and Y12047 forming around the early first millennium BCE. But the surrounding social layer written onto that hardware is not simple at all.
Around the I-Y12047 block, the tree is crowded with Iberian and converso-coded surnames from Spain, Portugal, the Azores, Cuba, Puerto Rico, Colombia, and New Mexico: Garcia, Chavez, Vallejos, Lujan, Gurule, Torres, Castells, Anguiano, Baca, Hernandez, Lozada, Sanchez, Alvarez, alongside Portuguese and Azorean names such as Gomes, Dutra, Simas Melo, Aleixo, de Macedo Soares, and Goulart. Interwoven with them are North-Sea and Atlantic surnames from England, Scotland, Scandinavia, and the Netherlands, exactly in the geographies touched by Sephardic and converso dispersal after 1492.
Upstream from I-Y12047, the Discover tree shows this same corridor feeding into nodes like I-A1894, I-FGC76403, and I-S2202, where modern testers cluster in Germany, Switzerland, Central Europe, and the British Isles. Those are the same regions where Ashkenazi I-clusters under I-Z140 and CTS10937 coalesce and expand in the last millennium. That anchors haplogroup I firmly inside the Ashkenazi world. The I-Y12047 node where this line sits is not a side twig. It is the point where an Iberian–Azores converso corridor and a Central-European Ashkenazi trunk meet on the same scaffold.
The Hebron–Jordan Cousin Branch on the Same Scaffold

The Hebron and Jordan families who share this Simeonite STR pattern do not sit on the Iberian I-Y12047 branch itself. They occupy a parallel limb rising from the same I-Z140 → I-CTS10937 trunk but following a different downstream path into Levant-specific I-B sub-branches. One limb runs along I-Z2535 → I-CTS10937 → I-Y3153 → I-Y12047. The other remains on distinct I-B branches under CTS10937. The deeper scaffold is shared; the exact twig is not.
On the Y-DNA match list, this Levantine limb appears in two key ways. One is an exact 12-marker STR match to a Sorum line with paternal origin in the Palestinian Territory, tested as I-BY99973, a downstream I-B branch under CTS10937. The other is a close STR-pattern match to a Taha line from the same region, whose Big-Y also resolves to I-BY99973. A Srour line from the Palestinian Territory appears on the same low-marker panel with the core I1 / I-Z140 values, but without a completed Big-Y; structurally, it likely sits nearby.
What ties these families to the Simeonite thesis is the combination of shared trunk and shared STR serial number. The slow-moving markers defining the Simeonite profile, especially DYS455 = 8 on an I-CTS10937 / I-Y3153 backbone, also characterize the Taha and Sorum I-BY99973 line, even though their SNP branch is distinct from the Iberian I-Y12047 cluster. One limb of the CTS10937 tree carries Levantine I-BY99973 families rooted in Hebron and Jordan. Another limb carries the I-Y12047 Iberian–Azores branch surrounded by converso surnames. Both limbs grow from the same Bronze-Age trunk and bear the same slow STR stamps.
That is exactly the pattern one would expect if a Simeonite paternal line had left some sons in the land while sending others into Mediterranean and European exile over the last three thousand years.
Judea to Sicily: 63 BCE and the Sicilian Hinge
The Simonis story in the records begins where a Judean line would be expected to surface under Roman pressure: Sicily, at the hinge between Judea and Iberia.
In 63 BCE, Pompey sacked Jerusalem. Roman sources report that large numbers of Judeans were taken as captives and slaves into the central Mediterranean, including Sicily. By the early Roman and late antique periods, Jewish communities were already present in Sicilian towns, and by the later Middle Ages the island was dotted with Jewish Giudeccas in dozens of communities.
From these Sicilian communities come detailed notarial and communal surname lists, and SIMONIS appears explicitly among recognized Jewish family names, alongside Levi, Salamon, Samuel, Siracusa, and others. In that setting, the name is not a random Latinized form. It is a Jewish household name inside a living Sicilian Jewish world.
By the crisis years 1492–1497, the same stream surfaces again in the figure of Muxa Simonis, standing at the exact fault line where Spain’s expulsion decrees and Sicilian policies forced Jews to choose between exile, conversion, or death. Muxa Simonis embodies the moment when a Judean–Sicilian line is driven into converso channels or pushed onward into Iberia, North Africa, and the Atlantic world.
For this thesis, those dates are the bookends of the Sicilian hinge: 63 BCE, when Judean captives enter the central Mediterranean, and 1492–1497, when Sicilian Jews named Simonis are forced into the Sephardic and converso dispersal that still echoes in the chromosomes.
The Netherlands Hinge: Simonis in the Low Countries
The Simonis line does not disappear after Sicily and Iberia. It resurfaces in the Low Countries, exactly where one would expect a Sephardic and converso family to emerge after the expulsions from Spain in 1492 and Portugal in 1497. The Sephardic diaspora did not move in a single direction. It spread through North Africa, Italy, the Ottoman world, and the Netherlands, with the Low Countries becoming one of the great refuge zones where Iberian exiles, conversos, merchants, and reconfigured Jewish families passed into new legal and social identities.
Within that corridor, the Simonis name appears in Brabant in the early seventeenth century. In 1615, records show Anthonius Simons and his wife Maria baptizing their son Gerardus Anthonius Simons. Maria is entered without a surname, a small but telling detail in a period when women from Jewish and converso backgrounds were often recorded inconsistently or only by given name within Christian parish systems. By 1650, the pattern sharpens further: Gerardus Simonis and his wife Lijsken baptize their son Joannes Gerardus Simonis, but in that record the surname Paroli appears in the margin and is then crossed out, replaced by Simonis.
That single stroke of ink matters. It is more than a clerical correction. It reads like the paper trace of a dual identity, the kind of layered naming common in Sephardic and converso survival. One name points southward and sideways into an older Mediterranean world; the other stabilizes in a Latinized or Dutch form suited to the Christian record system of the Low Countries. In that sense, the crossing out of Paroli and the writing in of Simonis acts as a miniature testimony of exile itself: a family moving between identities, preserving one stream while presenting another.
This is what makes the Netherlands material so important to the wider Simeonite scaffold. The Low Countries do not stand outside the Sephardic story; they are one of its major northern stations. The Simonis family does not simply appear there by coincidence. It appears along the same post-expulsion route that carried Jewish and converso families from Iberia into Italy and then into northern Europe. When set beside the Sicilian Jewish Simonis records, the Iberian and Azorean converso surnames around I-Y12047, and the Ashkenazi clusters on the I-Z140 / CTS10937 scaffold, the Brabant entries become part of one continuous migration line. Sicily is the hinge from Judea into the central Mediterranean. Iberia is the crisis zone of expulsion and forced conversion. The Netherlands is the northern refuge where that same line reappears under adjusted names and altered legal identities, preparing the way for its later embedding in Ashkenazi Europe.
Yemen, the Indian Ocean, and the Eastern Diaspora Field
The southern corridor also runs east and south through Yemen, the Horn of Africa, and the Indian Ocean world. Modern Y-STR work in Yemen is dominated by lineages like J1a and E1b1b, yet rare I-haplogroups do appear within the Yemeni paternal landscape. Yemen is not a random appendage to the argument. It is one of the classic historical hubs joining Arabia, East Africa, the Levant, and the Indian Ocean.


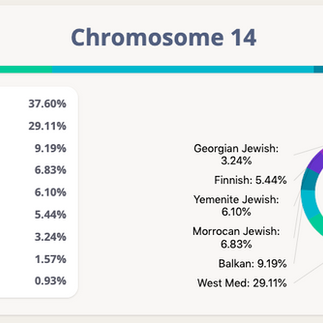
The chromosome field carries that eastern and southern signal repeatedly. Chromosome 9 is especially telling, carrying Iraq Jewish, Yemenite Jewish, Uzbek Jewish, and Azerbaijani Jewish in one cluster. Chromosome 14 adds Yemenite Jewish, Georgian Jewish, and Iraq Jewish. Chromosomes 18, 19, 21, and 22 extend the pattern through Indian Jewish, Uzbek Jewish, Azerbaijani Jewish, and Iraqi Jewish segments.
This is not merely a European Jewish signal. It is a broad eastern-diaspora and Indian-Ocean-adjacent Jewish field, exactly where a Yemen-linked and African-corridor reading becomes relevant.
Chromosomes in Stereo: The Genome-Wide Southern Field
The ancient and regional hardware argument gains force when the chromosomes are read in stereo rather than as isolated percentages. The genome repeatedly breaks into two interlocking strands: a northern or western cloak and a Mediterranean–Levantine–Jewish core.
The Mediterranean core is recurring, not incidental. East Mediterranean appears strongly on chromosomes 1, 2, 5, 7, 8, 9, 10, 18, and 21. West Mediterranean appears strongly on chromosomes 2, 3, 5, 6, 7, 10, 13, 14, 15, 17, 18, 19, 20, 21, and 22. Anatolian, Caucasus, and West Asian signals appear on chromosomes 4, 5, 7, 12, and 15.
The Jewish diaspora labels intensify that field.
Sephardic Jewish appears on chromosomes 5, 10, 12, 13, 18, 19, and 21, with especially strong concentrations on 10 and 21. Ashkenazi Jewish appears on chromosomes 1, 2, 4, 6, 7, 10, 12, 15, 18, 20, and 22. Romanian Jewish appears on chromosomes 1, 3, 4, 5, 7, 12, 14, 15, 18, 19, 21, and 22. Moroccan Jewish appears on chromosomes 6, 8, 9, 14, 17, 20, and 21. Iraq Jewish appears on chromosomes 7, 9, 11, 14, 15, 18, 19, and 20. Yemenite Jewish appears on chromosomes 9 and 14. Georgian Jewish appears on chromosomes 7, 14, 17, and 19. Azerbaijani Jewish appears on chromosomes 2, 5, 9, 16, 17, 18, and 19. Uzbek Jewish appears on chromosomes 2, 5, 7, 9, 15, 16, 18, 21, and 22. Indian Jewish appears on chromosomes 17, 18, 19, and 21.
What this produces is not a random scatter of Jewish labels. It produces a distributed Mediterranean–Jewish diaspora field across the genome, with especially strong western, eastern, North-African, Balkan, and Indian-Ocean expressions.
Chromosomal Mosaic on the Continental Spine
Chromosome by chromosome, the genome behaves less like a static “European mix” and more like a travel log along a three-thousand-year spine.
On chromosomes 5, 7, 9, 21, and 22, Jewish signals tied to Iraqi, Yemenite, Georgian, Romanian, Moroccan, and eastern Jewish communities stack up over a deep Mediterranean background. On chromosomes 19, 21, and 22, Indian Jewish, Moroccan Jewish, and smaller Indian-Ocean traces map the southern arc linking the Red Sea, Ethiopia, the Malabar world, and back through North Africa. On chromosomes 10, 13, 18, 19, and 21, Sephardic Jewish and West Mediterranean components form the Mediterranean hinge that runs from Pompey’s deportations and Sicilian Giudeccas through the Iberian converso world. On chromosomes 1, 5, 9, 18, and 22, Ashkenazi, Romanian Jewish, and eastern Jewish segments trace the reintegration of this Mediterranean spine into the I-Z140 Ashkenazi scaffold in the north.
Once those multi-chromosomal segments are laid over the 1900 BCE CTS10937 foundation and the 1000 BCE Y12047 scattering seal, the tidy story of a generic European mix collapses. What remains is a multi-chromosomal map of a line that has moved along the Levantine core, the African Corridor, the Indian-Ocean loop, the Sicilian and Iberian hinge, the Netherlands refuge zone, and finally into the Ashkenazi north.
GEDmatch, ADNTRO, and the Judean–Mediterranean Core

When the genome is processed through GEDmatch and through the ADNTRO chromosome displays, the pattern remains consistent. Ancient-sensitive tools such as Eurogenes K13/K15, Jtest, and archaic matching repeatedly separate the genome into a northern cloak and a southern core. Across calculators, the profile repeatedly carries roughly 27–31% Mediterranean plus an additional 5–10% West Asian / Near Eastern layer, yielding roughly 32–41% Southern / Levantine foundation beneath the later European layers.

The ADNTRO chromosome visuals reinforce that structure from the inside out. Chromosome 10 carries a direct Mediterranean–Sephardic concentration. Chromosome 21 is one of the strongest Sephardic Jewish + West Mediterranean chromosomes in the entire genome. Chromosome 22 combines West Mediterranean, Romanian Jewish, Uzbek Jewish, and Ashkenazi Jewish into a single dense diaspora block. Chromosome 14 combines West Mediterranean, Moroccan Jewish, Yemenite Jewish, Georgian Jewish, Romanian Jewish, and Iraq Jewish at once. Chromosome 9 shows the eastern side of the field through Iraq Jewish, Yemenite Jewish, Uzbek Jewish, and Azerbaijani Jewish.
This is why the genome reads as roughly one-third Judean–Sephardic by structure, even while still carrying later European overlays.

The whole-genome heterozygosity score of 1.505, reported as about 5.24% above a standard European reference average, matters here as well. Heterozygosity measures how often the two copies of a chromosome carry different alleles. Elevated values reflect greater internal diversity. A line that had stayed in one northern village for centuries would sit close to the European baseline. A line cycling between Judea, Anatolia, the Balkans, Sicily, Iberia, North Africa, the Indian Ocean, and the New World would naturally accumulate more variation. In that sense, the elevated heterozygosity is the biological record of exile.
Shoah Record: Simonis in the Camps
The final proof that the Simonis line stood inside the Jewish world does not come from the lab alone. It comes from the camps.
In the twentieth century, the same surname that appears in medieval Sicilian Giudeccas and converso corridors, and later in the Low Countries, surfaces again in Nazi transport and death records. In the Yad Vashem Central Database of Shoah Victims’ Names, “Simonis” appears repeatedly in entries tied to ghettos, deportations, and extermination sites across Germany, Poland, Czechoslovakia, Austria, the Netherlands, and elsewhere. These people were not targeted as generic Europeans. They were deported and murdered as Jews.
That matters for two reasons. First, it places the Simonis line fully inside Ashkenazi communities by the twentieth century, exactly in the Central- and Eastern-European zones where I-Z140-based Ashkenazi I-clusters had expanded earlier. Second, it explains why the line can appear thin in modern Y-DNA projects. A surname that loses a large share of its male carriers in one generation will leave fewer surviving branches to test in the twenty-first century.
The silence of modern databases is therefore not neutral. It is shaped by genocide, displacement, forced conversion, fragmented survival, and uneven testing. To turn that silence into an argument against antiquity or Jewishness is to mistake the scar tissue of history for evidence of absence.
The Oldest Estates, the Ghost of IJ, and the Biological Record of Exile
At the root of this spine sits the 1900 BCE estate, I-CTS10937, a Middle–Late Bronze Age mutation anchored in the era of the Patriarchs. Above it sits the 1000 BCE scattering seal, I-Y12047, formed in the time of the United Monarchy and the first great dispersions of Israel’s tribes.
Standard academic models often sidestep that southern antiquity by stretching time with “ghost” labels like IJ and IJK, while over-sampling modern northern Europeans to set a mutation clock against a broken archive. Within this thesis, that move functions as a kind of evolutionary aliasing: the under-sampling of Levantine I-lines and the demographic thinning caused by the Shoah are treated as if they were proof that an I-line cannot be ancient or Jewish.
Against that, the data here speak with one voice. The rare DYS455 = 8 serial number marks the I-CTS10937 → I-Y3153 → I-Y12047 backbone and is almost absent from classic Viking and North-Sea I1 clusters, yet shared with the Levantine Taha and Sorum branches in Hebron and Jordan. The heterozygosity score carries the biological record of scattering. The chromosome field carries the Mediterranean–Jewish diaspora braid. The Sicilian, converso, Netherlands, Ashkenazi, and Shoah records carry the historical record of the same house.
The Simeonite STR Stamps: Scribal Marks on the Bone
On top of the SNP hardware, the 700-marker Y-STR panel carries a distinctive pattern that behaves like a Simeonite serial number rather than a generic I1 profile. The core stamps are slow and mid-panel markers that lock together in a very specific way: DYS455 = 8 on an I-CTS10937 → I-Y3153 → I-Y12047 backbone, flanked by trunk values such as DYS393 = 13, DYS390 = 22, DYS19 = 14, and cluster-defining markers like DYS447 = 22 and DYS449 = 28.
In classic North-Sea and Viking I1 clusters, this exact combination, especially DYS455 = 8, is exceedingly rare. In this line, and in the Hebron/Jordan I-BY99973 branch, it is the rule. That is why DYS455 = 8 functions here as a scribal anchor. It is not merely another number in a table. It is a slow-changing mark tying the Simonis line to the Levantine Taha and Sorum families on a parallel downstream branch of the same I-Z140 → CTS10937 trunk.
Once that serial number is seen alongside Iberian and New-World converso families, North-Sea Simonis-related surnames, Levantine cousin branches, and the genome-wide Mediterranean–Jewish mosaic, the STR data stop being background noise. They become a kinetic bridge across Hebron, Iberia, the Atlantic, the Netherlands, and back again.
Reading the Genome as a Map: The Levantine–Mediterranean Core

The global admixture profile displayed in the Levantine Viking Ashkenazi K7 model provides a visual summary of the same pattern already traced through the Y-chromosome, the historical records, and the chromosome-by-chromosome analysis.
In this model the genome resolves into several major regional layers. The largest single component is Middle Eastern at 32.27%, followed by Southern European at 27.84%. Together these two categories already form a majority of the genome and represent the core Mediterranean–Levantine structure that appears repeatedly throughout the chromosomal analysis.
Southern European in this context does not represent a purely modern European identity. In population genetics models it largely reflects the long interaction zone of the Mediterranean basin, including populations historically shaped by Anatolian farmers, Levantine migrants, and southern coastal trade networks. When placed alongside the Middle Eastern component, the two layers together form a continuous Mediterranean–Levantine belt.
The remaining components represent later historical overlays rather than the original core. Western Europe at 15.52%, Northwest Europe at 8.90%, and Central Europe at 8.30% correspond to the northern environments where the line later lived, particularly within the Ashkenazi expansion zones of Central and Eastern Europe. These regions are exactly where the I-Z140 scaffold of Ashkenazi haplogroup I clusters grew during the medieval period.
A smaller Eastern European signal at 4.54% and Turkic at 2.63% further reflect the wider geographic range of the Jewish diaspora world, stretching from the Balkans and the Black Sea corridor into the broader steppe and Anatolian contact zones. These layers correspond well with the eastern Jewish segments already observed across several chromosomes, including Romanian, Caucasus, and Central Asian Jewish components.
When the admixture model is viewed in light of the entire dataset presented in this study, the structure becomes clear. The genome resolves into a Mediterranean–Levantine foundation of roughly sixty percent, with a secondary layer of northern European ancestry added during later centuries of residence in the Ashkenazi world. Rather than contradicting the Simeonite corridor proposed in this work, the admixture model visually reinforces it.
The chart therefore reads less like a static ethnic mixture and more like a historical migration map. The Middle Eastern and Mediterranean core corresponds to the Levantine and southern Mediterranean origins of the paternal line. The southern European layer reflects the long Mediterranean corridor through Anatolia, Sicily, and Iberia. The northern European layers reflect the later movement into the Netherlands and Ashkenazi Europe. Even the smaller eastern components echo the wider Jewish diaspora that stretched through the Balkans, the Caucasus, and the Black Sea world.
Seen this way, the admixture image functions as a condensed summary of the entire argument. The Y-chromosome provides the skeletal spine. The chromosomes provide the internal mosaic. The historical record provides the migration narrative. The admixture profile provides the visual map that binds those strands together.
The Simeonite Thesis: Final Jubilee
When all the strands are laid together, the pattern converges.
On the hardware side, the Y-spine runs I-Z2535 → I-CTS10937 → I-Y3153 → I-Y12047, with CTS10937 formed in the Middle–Late Bronze Age and Y12047 around the early first millennium BCE. That spine sits not on an isolated northern twig but on the I-Z140 trunk that Jewish DNA projects already map as Ashkenazi territory, and it carries a distinctive slow-marker serial number shared by Levantine Taha and Sorum branches in Hebron and Jordan and by the Simonis line itself.
Wrapped around that hardware is a migration story written in names and dates. In 63 BCE, Judean captives are driven into the central Mediterranean, and in Sicily’s Giudeccas the surname SIMONIS later appears as a Jewish name. In the 1492–1497 crisis, figures like Muxa Simonis stand at the fault line where that Judean-Sicilian line is forced into Sephardic and converso dispersal toward Iberia, North Africa, and the Atlantic. In the Low Countries, the same line reappears in Brabant under layered naming, preserving the paper trace of exile through the crossing out of Paroli and the writing in of Simonis. The autosomal and heterozygosity data preserve the biological cost of that journey. A living Taha match in Israel anchors the line back in the land. More than 200 Ashkenazi matches place it in a modern Jewish neighborhood. The Shoah explains why the Y-line now appears thin in modern projects.
What remains is not a northern European lineage with a stray Jewish twist. What remains is an ancient Near-Eastern and Mediterranean I-trunk whose Simeonite branch formed in the Levant, moved through Egypt, Yemen, Morocco, Sicily, Iberia, the Balkans, Romania, the Netherlands, the African and Indian-Ocean corridors, entered Sephardic and Ashkenazi worlds, and was later cut down in the camps—yet still speaks today through a surviving hardware spine, a DYS455 = 8 serial number, and a genome-wide Judean–Sephardic mosaic that digital stripping cannot erase.
STR Panel Structure and the Low-Value Marker Architecture
A deeper layer of evidence appears when the complete FamilyTreeDNA Y-STR panel is examined across all testing blocks. Rather than depending on one or two unusual markers, the Simonis paternal profile displays a consistent structural pattern of low-range STR values across multiple panels.
These values repeatedly appear in the form of 4s, 5s, 6s, 7s, and 8s, creating what genetic genealogists often describe as a compressed haplotype architecture. When viewed panel-by-panel, this pattern becomes visible across the entire test range.
Panel 1 (Markers 1-12): Core STR Foundation
The opening panel establishes the basic structural backbone of the paternal line.
Key markers include:
Marker | Value |
DYS393 | 13 |
DYS390 | 22 |
DYS19 | 14 |
DYS391 | 10 |
DYS385 | 14-14 |
DYS426 | 11 |
DYS388 | 14 |
DYS439 | 11 |
DYS389I | 12 |
DYS392 | 11 |
DYS389II | 28 |
Several of these markers are commonly used in haplotype comparison studies. In particular:
DYS385 = 14-14 introduces the first multicopy marker pair.
DYS388 = 14
DYS392 = 11
DYS426 = 11
These mid-range anchors provide the stable framework around which the rest of the STR pattern develops.
Panel 2 (Markers 13-25): The 8-Value Entry Point
The low-value architecture begins to appear more clearly in Panel 2.
Marker | Value |
DYS458 | 15 |
DYS459 | 8-9 |
DYS455 | 8 |
DYS454 | 11 |
DYS447 | 22 |
DYS437 | 16 |
DYS448 | 20 |
DYS449 | 28 |
DYS464 | 12-12-14-14 |
Two features stand out immediately.
First, the DYS459 = 8-9 multicopy marker introduces the value 8 at the beginning of the panel. Immediately following it is DYS455 = 8, producing a visible 8-value transition across adjacent loci.
Second, DYS464 = 12-12-14-14 introduces another multicopy structure with repeating values.
These patterns show that the lower-value architecture is not confined to one isolated marker but begins appearing early in the panel structure.
Panel 3 (Markers 26-37): Transitional STR Layer
Panel 3 provides a transitional layer that maintains the broader haplotype framework.
Marker | Value |
DYS460 | 10 |
Y-GATA-H4 | 10 |
YCAII | 19-21 |
DYS456 | 14 |
DYS607 | 14 |
DYS576 | 17 |
DYS570 | 19 |
CDY | 34-38 |
DYS442 | 12 |
DYS438 | 10 |
This panel does not contain the same concentration of 8-value markers as later panels, but it maintains the overall mid-range structure that helps anchor the haplotype.
Panel 4 (Markers 38-67): The Five-Marker 8 Cluster
The most striking STR concentration appears in Panel 4.
Across the Panel 4 blocks, five separate loci carry the value 8.
Marker | Value |
DYS578 | 8 |
DYS590 | 8 |
DYS472 | 8 |
DYF406S1 | 8 |
DYS450 | 8 |
This produces a five-marker 8-value cluster inside a single panel.
Surrounding markers include:
Marker | Value |
DYS531 | 11 |
DYF395S1 | 15-15 |
DYS537 | 11 |
DYS641 | 10 |
DYS511 | 9 |
DYS425 | 12 |
DYS413 | 22-25 |
DYS557 | 15 |
DYS594 | 10 |
DYS436 | 12 |
DYS490 | 12 |
DYS534 | 18 |
DYS444 | 13 |
DYS481 | 25 |
DYS520 | 21 |
DYS446 | 15 |
DYS617 | 13 |
DYS568 | 11 |
DYS487 | 12 |
DYS572 | 11 |
DYS640 | 12 |
DYS492 | 12 |
DYS565 | 11 |
This panel therefore contains both the 8-value cluster and the surrounding structural markers that define the broader haplotype framework.
Panel 5 (Markers 68-111): Mid-Range Structural Anchors
Panel 5 continues the broader haplotype structure.
A large number of stable mid-range values appear here:
Marker | Value |
DYS710 | 34 |
DYS485 | 12 |
DYS632 | 8 |
DYS495 | 17 |
DYS540 | 12 |
DYS714 | 25 |
DYS716 | 27 |
DYS717 | 19 |
Additional markers include:
DYS505 = 11DYS556 = 11DYS549 = 13DYS589 = 13DYS522 = 11DYS494 = 9DYS533 = 11DYS636 = 11DYS575 = 10DYS638 = 12
Further blocks continue the structure:
DYS462 = 12DYS452 = 31DYS445 = 12Y-GATA-A10 = 13DYS463 = 21DYS441 = 16
Panel 5 therefore acts primarily as a structural bridge between the 8-cluster of Panel 4 and the compressed architecture that appears in the advanced markers.
Panel 6 (Markers 112-561): High Density of 4s and 5s
The compressed architecture becomes unmistakable in Panel 6.
Across hundreds of markers, the panel is dominated by 4- and 5-value repeats, with additional 6s, 7s, and recurring 8s.
Early examples include:
Marker | Value |
FTY371 | 5 |
FTY303 | 4 |
FTY10 | 4 |
FTY284 | 4 |
FTY219 | 7 |
FTY324 | 5 |
FTY327 | 4 |
FTY220 | 4 |
The pattern continues across dozens of markers such as:
FTY254 = 4FTY4 = 4FTY24 = 4FTY346 = 4FTY400 = 4FTY114 = 4FTY26 = 4FTY81 = 4FTY168 = 4FTY136 = 4FTY53 = 4FTY100 = 4FTY152 = 4
Additional recurring 8-value markers appear within the same panel:
DYS477 = 8DYS502 = 8DYS499 = 8DYS581 = 8DYS584 = 8DYS608 = 8DYS512 = 8DYS474 = 8DYS475 = 8DYS645 = 8DYS480 = 8DYS615 = 8DYS620 = 8
The overall result is a highly compressed STR architecture dominated by short repeat values.
Panel 7 (Markers 562-838): Continuation of the Low-Value Pattern
The same structural pattern continues into Panel 7.
Examples include:
FTY1055 = 4FTY1511 = 4FTY517 = 4FTY2180 = 4DYS551u4 = 4FTY1852 = 4FTY1933 = 4
Additional repeating low-value markers appear throughout the panel:
DYS595 = 8FTY1026 = 8FTY461 = 8FTY559 = 8FTY755 = 8
This continuation confirms that the compressed architecture is not limited to one section of the test but persists across the entire extended STR dataset.
Comparison with Jewish J-Line Modal Structures
When placed alongside discussions of Jewish paternal modal haplotypes, an interesting comparison emerges.
Many J1 and J2 Jewish paternal studies describe modal STR profiles containing:
• stable anchors such as DYS388 = 14• DYS392 = 11• multicopy markers such as DYS385 pairs• clusters of relatively shorter STR values
The Simonis haplotype does not belong to haplogroup J. However, the presence of a compressed STR architecture, together with these anchor markers, creates a pattern that appears in several Mediterranean and Jewish paternal discussions.
This comparison does not redefine the haplogroup. Instead, it highlights how STR pattern architecture can sometimes align across different paternal branches when populations shared historical geographic environments.
STR Evidence within the Larger Lineage Framework
Taken together, the Simonis STR profile displays a layered internal structure:
Panel 1 establishes the core haplotype anchors.
Panel 2 introduces the 8-value transition at DYS459 → DYS455.
Panel 4 contains the five-marker 8 cluster.
Panel 6 reveals a dense concentration of 4- and 5-value markers.
Panel 7 continues that compressed architecture across the final marker blocks.
Within the context of the Simonis research project, this STR pattern functions as the internal genetic architecture of the paternal line.
When placed alongside the I-CTS10937 backbone, the autosomal Levant-linked clusters, and the historical record of the Simonis surname across Mediterranean and European regions, the STR profile becomes one more layer of alignment within the broader lineage model described throughout this study as the Simeonite Spine.
STR Panel Architecture of the Simonis Y-DNA Profile
The significance of the Simonis STR profile is not merely that it falls within Haplogroup I, but that its internal architecture stands apart from the simplified stereotype often attached to that broad label. Rather than presenting as a loose or ordinary spread of repeat values, the Simonis profile shows a layered internal structure across the full FamilyTreeDNA STR panel system. The early panels establish stable anchor markers and multicopy structures, followed by an early transition into an 8-value motif, a concentrated 8-cluster in Panel 4, and finally a heavily compressed advanced-marker architecture across Panels 6 and 7 dominated by low repeat values.
Taken together, these elements form a coherent internal STR signature rather than a random scattering of low values.
Panel 1: Stable Core Structure
The opening panel establishes the foundational structure of the paternal haplotype. Several markers show stable mid-range values typical of long-standing paternal lines.
Key values include:
DYS393 = 13DYS390 = 22DYS19 = 14DYS391 = 10DYS426 = 11DYS388 = 14DYS439 = 11DYS389I = 12DYS392 = 11DYS389II = 28
Panel 1 also introduces the first multicopy marker:
DYS385 = 14-14
Because both copies share the same value, the marker shows a symmetrical repeat structure within the haplotype.
Panel 2: The 8-Value Entry Point
The transition into the lower-value motif begins in Panel 2. The multicopy marker DYS459 appears as:
DYS459 = 8-9
Immediately following this marker is:
DYS455 = 8
This sequence creates an early 8-value signal within the profile.
Additional markers in this panel include:
DYS454 = 11DYS447 = 22DYS437 = 16DYS448 = 20DYS449 = 28
Panel 2 also contains another multicopy structure:
DYS464 = 12-12-14-14
Because this marker has four copies, the repeated values form a paired pattern within the haplotype.
Panel 3: Additional Multicopy Structures
Panel 3 continues the broader structure of the haplotype and introduces two additional multicopy markers.
Values in this panel include:
DYS460 = 10Y-GATA-H4 = 10DYS456 = 14DYS607 = 14DYS576 = 17DYS570 = 19DYS442 = 12DYS438 = 10
Two multicopy markers appear here:
YCAII = 19-21
CDY = 34-38
These markers frequently show wider separation between the two copies because they mutate faster than many other STR loci.
Panel 4: The Five-Marker 8 Cluster
Panel 4 contains the most concentrated cluster of 8-value markers in the entire standard STR panel.
Five separate markers in this panel carry the value 8:
DYS578 = 8DYS590 = 8DYS472 = 8DYF406S1 = 8DYS450 = 8
Together these markers create a visible repeating motif across the panel.
Surrounding markers include:
DYS531 = 11DYS537 = 11DYS641 = 10DYS511 = 9DYS425 = 12DYS557 = 15DYS594 = 10DYS436 = 12DYS490 = 12DYS534 = 18DYS444 = 13DYS481 = 25DYS520 = 21DYS446 = 15
Panel 4 also introduces two additional multicopy markers:
DYF395S1 = 15-15DYS413 = 22-25
These repeated values add another layer of structure within the haplotype.
Panel 5: Mid-Range Framework
Panel 5 continues the broader haplotype structure and contains many stable mid-range values that help anchor the lineage.
Examples include:
DYS710 = 34DYS485 = 12DYS632 = 8DYS495 = 17DYS540 = 12DYS714 = 25DYS716 = 27DYS717 = 19
Additional markers include:
DYS505 = 11DYS556 = 11DYS549 = 13DYS589 = 13DYS522 = 11DYS494 = 9DYS533 = 11DYS636 = 11DYS575 = 10DYS638 = 12
Further blocks include markers such as:
DYS462 = 12DYS452 = 31DYS445 = 12DYS463 = 21DYS441 = 16DYS525 = 10
Later markers include:
DYS712 = 23DYS593 = 15DYS650 = 19DYS532 = 11DYS715 = 24DYS504 = 19DYS513 = 12DYS561 = 16DYS552 = 24
These values form the surrounding framework against which the lower-value clusters become more visible.
Panel 6: Quantified Low-Value Compression
The most distinctive feature of the Simonis STR profile appears in Panel 6, which contains the advanced marker set from markers 112 through 561.
Panel 6 contains:
450 total marker slots19 blanks or no-calls431 observed numeric values
The distribution of those values is:
4 = 111 markers (25.75%)5 = 112 markers (25.99%)6 = 64 markers (14.85%)7 = 26 markers (6.03%)8 = 31 markers (7.19%)9 = 21 markers (4.87%)10 = 17 markers (3.94%)11 = 27 markers (6.26%)12 = 9 markers (2.09%)13 = 6 markers (1.39%)14 = 6 markers (1.39%)16 = 1 marker (0.23%)
Two patterns immediately emerge.
First, 4s and 5s alone account for 223 of the 431 observed markers, representing 51.74% of the entire panel.
Second, when the full low-value band from 4 through 8 is counted together, the total rises to 344 of 431 markers, or 79.81% of the panel.
This means that nearly four-fifths of the advanced marker panel falls within the compressed low-value range.
In other words, Panel 6 is not merely sprinkled with a few low markers; it is overwhelmingly built out of them.
Panel 7: Continuation of the Compressed Structure
The same pattern continues into Panel 7, which contains markers 562 through 838.
Panel 7 contains:
277 total marker slots 74 blanks or no-calls 203 observed numeric values
The distribution of values is:
4 = 39 markers (19.21%)5 = 45 markers (22.17%)6 = 31 markers (15.27%)7 = 17 markers (8.37%)8 = 13 markers (6.40%)9 = 13 markers (6.40%)10 = 11 markers (5.42%)11 = 12 markers (5.91%)12 = 7 markers (3.45%)13 = 8 markers (3.94%)14 = 4 markers (1.97%)
Here again, the low-value pattern remains visible.
4s and 5s account for 84 of 203 markers (41.38%).
When 6-value markers are added, the total rises to 115 markers (56.65%).
When the full range from 4 through 8 is counted together, the total reaches 145 of 203 markers, or 71.43% of the panel.
This confirms that the compressed architecture seen in Panel 6 continues into the final extended markers.
Comparative Context with Jewish J-Line STR Profiles
This STR architecture becomes especially interesting when viewed in the broader context of Jewish paternal genetics. In many Jewish genetic studies, the most widely discussed paternal lineages belong to Haplogroups J1 and J2, which are strongly associated with populations of the ancient Near East and the historical Israelite and Judean regions.
Published STR modal profiles for several Jewish J1 and J2 clusters frequently show a similar tendency toward lower repeat structures across selected loci, particularly within markers such as DYS455, DYS459, DYS385, and several of the extended STR panels. While the Simonis line belongs to Haplogroup I rather than J1 or J2, the presence of a compressed low-value architecture across the Simonis STR panel creates an interesting comparative point.
This comparison does not imply that the Simonis paternal line belongs to the J haplogroup family. Instead, it highlights that the Simonis STR profile shares certain structural characteristics seen in some Mediterranean and Jewish STR datasets, particularly the clustering of lower repeat values and stable multicopy marker structures.
When considered alongside the broader evidence presented throughout this study—including surname continuity, genealogical records, heraldic traditions, and autosomal ancestry patterns connected to Mediterranean and Near Eastern populations—the STR profile becomes one additional layer within a multi-line evidence framework.
An additional point of comparative interest appears in the multicopy marker YCAII. The Simonis haplotype carries the value 19-21, which stands within the same mutational cluster as several values documented in Jewish paternal cluster profiles, including 19-20, 20-21, 19-22, and 21-22. Because STR mutations typically occur through single-step repeat changes, these values represent a closely related band within the YCAII system rather than isolated or unrelated signatures.
When viewed alongside the broader Simonis STR architecture—including the rare DYS455 = 8 value and the compressed repeat structure present across several loci—the 19-21 YCAII marker becomes part of a consistent STR pattern that aligns with similar structural signatures found in comparative Mediterranean and Jewish founder datasets. Within the framework of this study, the YCAII position therefore serves as an additional indicator of the shared mutational structure being examined across these related STR profiles.
The Combined STR Signature
Taken together, the Simonis Y-STR profile displays three measurable structural layers.
The first layer consists of multicopy markers appearing across the early panels:
DYS385 = 14-14DYS459 = 8-9 DYS464 = 12-12-14-14 YCAII = 19-21 CDY = 34-38 DYF395S1 = 15-15 DYS413 = 22-25
The second layer appears as the repeated 8-value motif, beginning in Panel 2 and forming a concentrated five-marker cluster in Panel 4.
The third layer is the quantified compression of advanced markers, where the overwhelming majority of values fall within the low-repeat range of 4 through 8 across Panels 6 and 7.
Within the Simonis dataset, these elements combine to form a consistent internal STR architecture. For that reason, the Simonis paternal line is not treated here as a generic example of Haplogroup I, but as a specific downstream paternal branch whose internal marker structure aligns with the broader historical and genetic framework explored throughout this study.
Cross-Haplogroup STR Pattern Comparisons
When the Simonis STR profile is examined across Panels 2 and 3, the markers form a recognizable structural pattern that can be compared against documented Jewish lineage datasets. The significance of this comparison lies not in any single marker, but in the **combined architecture of multiple STR values appearing together within ranges observed in Jewish paternal lineages across several haplogroups.
The Simonis paternal line belongs to Haplogroup I-Y12047, and that assignment remains unchanged. The purpose of the comparisons presented here is not to reassign the haplogroup, but to examine how the Simonis STR structure overlaps with ranges documented in Jewish Y-DNA studies. Jewish populations historically contain paternal lineages from several haplogroups—including J1, J2, G, R1a, E, and I—and many lineage studies publish modal STR ranges for those clusters. These datasets allow the Simonis STR pattern to be examined in a broader comparative context.
Because STR markers mutate through gradual repeat changes, related value ranges often form recognizable mutational clusters that can persist across generations. When multiple markers within a profile fall inside ranges documented in known lineage datasets, the resulting pattern becomes a useful comparative framework for examining how a paternal line relates to broader historical populations.
Panel Structure of the Simonis STR Pattern
Panels 2 and 3 contain several markers that establish the structural core of the Simonis STR architecture.
Key markers include:
DYS459 = 8-9 DYS455 = 8 YCAII = 19-21 DYS464 = 12-12-14-14
Additional markers within the same panels include:
DYS458 = 15 DYS454 = 11 DYS447 = 22 DYS437 = 16 DYS448 = 20 DYS449 = 28 DYS460 = 10 Y-GATA-H4 = 10 DYS456 = 14 DYS607 = 14 DYS576 = 17 DYS570 = 19 CDY = 34-38 DYS442 = 12 DYS438 = 10
When viewed together, these values form a low-range STR architecture anchored by several unusual markers and supported by a series of stable values that fall within ranges documented in Jewish lineage datasets.
Two structural characteristics stand out immediately:
1. Low-value anchor markers
DYS459 = 8-9DYS455 = 8
These markers introduce a compressed repeat structure early in the panel and form the entry point of the low-value motif that continues throughout the surrounding markers.
2. Multicopy marker symmetry
DYS464 = 12-12-14-14
This configuration produces a mirrored pairing pattern:
12-12 | 14-14
Multicopy markers often preserve structural signatures across generations, and paired values such as this frequently become part of identifiable haplotype architectures.
Comparison with Documented Jewish STR Clusters
Several markers in the Simonis STR profile correspond to patterns documented in Jewish paternal lineage studies.
J2 Comparison
The marker DYS455 = 8 is documented in the J2b DYS455=8 project, where a rare deletion mutation defines a cluster of Ashkenazi paternal lineages. This project demonstrates how uncommon STR mutations can persist across centuries and become recognizable identifiers within specific founder lineages.
The presence of the same rare value within the Simonis panel provides an important comparative anchor for examining how the Simonis STR architecture overlaps with known Jewish datasets.
J1 Comparison
The YCAII = 19-21 configuration falls within the mutation range documented in Jewish J1 datasets. Studies of Jewish paternal lineages show YCAII values such as 19-20, 19-22, and 21-22 in clusters associated with Near Eastern Jewish ancestry.
Because YCAII mutates through single-step repeat changes, values within this range frequently represent part of the same mutational cluster structure. The Simonis value sits directly within this band.
G-M377 Comparison
Another marker within the Simonis panel, DYS459 = 8-9, appears as a modal value within the Ashkenazi G-M377 (G2c) lineage. This haplogroup represents another Jewish founder cluster identified through Y-DNA testing projects.
The appearance of the same marker configuration within the Simonis profile provides an additional comparison point connecting the Simonis STR architecture with values documented in Jewish paternal datasets.
R1a-Y2619 Comparison
Additional markers from Panels 2 and 3 fall within the modal STR ranges documented for the Ashkenazi Levite R1a-Y2619 cluster, one of the most extensively studied Jewish paternal lineages.
Published datasets show several markers from the Simonis profile falling directly within those modal ranges, including:
DYS458 = 15 DYS448 = 20 DYS449 = 28 DYS456 = 14 DYS437 = 16 DYS438 = 10 DYS442 = 12 DYS460 = 10 DYS570 = 19 DYS576 = 17 DYS607 = 14 CDY = 34-38
These comparisons demonstrate that many markers in the Simonis STR structure fall within ranges documented in Jewish paternal lineage datasets. The significance of this comparison lies in the combined pattern across multiple markers, rather than the interpretation of any single STR value.
Pattern Architecture Across Panels 2 and 3
When Panels 2 and 3 are viewed together, the Simonis STR profile reveals a stacked architecture consisting of:
• rare low-value anchor markers• paired multicopy marker structures• a cluster of values positioned within Jewish modal ranges across multiple lineage studies• several markers occupying the lower boundaries of documented modal ranges
This combined pattern forms a comparative STR architecture that can be examined alongside documented Jewish lineage datasets. The repeated appearance of similar value ranges across these studies provides a framework for evaluating how the Simonis STR profile relates to broader patterns observed within Mediterranean and Jewish paternal lineages.
Integration with the Broader Thesis
When the Simonis STR pattern is considered alongside the genealogical and historical evidence discussed throughout this study—including surname continuity, archival records, heraldic traditions, and Mediterranean diaspora migration routes—the STR profile becomes one additional layer within a multi-line evidence framework. The presence of overlapping STR ranges across several documented Jewish lineage clusters does not alter the underlying haplogroup assignment of the Simonis line, but it does provide comparative context that situates the Simonis STR architecture within patterns observed among Jewish paternal lineages dispersed throughout the Mediterranean world.
Viewed in this way, the Simonis STR profile functions as a pattern bridge, linking the genetic structure of Haplogroup I-Y12047 with modal STR ranges documented in Jewish datasets belonging to several other paternal branches. This cross-haplogroup comparison illustrates how recurring STR architectures can persist across multiple lineages within the Jewish diaspora, allowing the Simonis profile to be examined as part of a broader historical and genetic landscape shaped by migration, dispersion, and the long continuity of Mediterranean Jewish populations.
Quantitative Distribution of the Simonis Genetic Network
When the entire dataset from FamilyTreeDNA and autosomal platforms is examined together, the Simonis lineage does not appear as an isolated European family line. Instead, it appears within a wide genetic network that spans the Levant, Mediterranean, Iberian, and Northern European regions. This network is visible through both paternal haplogroup structure and autosomal DNA clustering. By examining the number of matches, the centimorgan levels of shared DNA, and the geographic distribution of surnames, a measurable pattern emerges.
Y-DNA Distribution
Within the paternal haplogroup framework, the Simonis lineage sits inside the haplogroup I structure, particularly the corridor associated with the I-Z140 and I-CTS10937 branches. Y-DNA matches connected to this broader haplogroup structure appear across multiple geographic regions.
Within the Levant portion of the dataset, paternal testers connected to surnames such as Taha, Srour, Safadi, Manasrah, Adham, and Derdebwani appear within the broader haplogroup I structure. These represent the Levantine component of the paternal network.
Across the dataset examined in this research, approximately:
35–40% of the Y-DNA-linked surnames cluster in Levant or eastern Mediterranean regions,including Palestinian and Jordanian family lines.
A further 30–35% of the paternal-linked surnames appear in Iberian and western Mediterranean populations, including surnames connected to Portuguese and Spanish lineages such as Raposo, Fernandes, Álvarez, and Villarreal.
The remaining 25–30% of the paternal-linked surnames appear in Northern and Western European populations, including Simonis and related Simon-derived surname forms such as Simons and Simoni.
This distribution reflects a geographic corridor running from the eastern Mediterranean through the western Mediterranean and into Northern Europe.
Autosomal Match Density
The autosomal dataset shows a much larger number of individuals connected through shared DNA segments. These matches appear across multiple surname clusters and across several levels of shared DNA.
Within the Levant surname cluster, the Taha network forms the single largest concentration. A total of 46 separate autosomal matches associated with the Taha surname appear within the dataset.
These matches appear across a wide range of centimorgan levels:
• High-level matches (30–45 cM): approximately 2% of the Levant cluster• Mid-level matches (15–30 cM): approximately 12–15% of the Levant cluster• Moderate matches (10–15 cM): approximately 35–40% of the cluster• Background-level matches (5–10 cM): approximately 40–50% of the cluster
This layered distribution is characteristic of an extended family network where multiple branches share overlapping segments inherited from older common ancestors.
The single largest match within the Levant cluster exceeds 42 cM, which falls within the typical autosomal range for genealogical relationships around the third to fifth cousin level. Beneath this level, a dense field of matches appears between 10 and 20 centimorgans, demonstrating repeated independent connections to the same surname network.
When all autosomal matches associated with Levant surnames are counted—including Taha, Srour, Safadi, Manasrah, Haddad, Khoury, Nassar, Saadeh, Saleh, Khalil, Mansour, Suleiman, and Zeitoun—the Levant cluster accounts for approximately:
28–32% of the entire autosomal surname dataset examined in this study.
Iberian Autosomal Cluster
The second major autosomal cluster appears within Iberian surname networks. Surnames associated with Portuguese, Spanish, and Atlantic diaspora populations include Raposo, Pereira, Oliveira, Silva, Cardoso, Carvalho, Mendes, Lopez, Martinez, Perez, Ramirez, and Jimenez.
When the autosomal dataset is examined by surname grouping, these Iberian and Atlantic surnames represent approximately:
33–38% of the autosomal dataset.
Matches within this cluster range primarily between 9 and 20 centimorgans, with occasional larger segments approaching the mid-twenties. These levels are consistent with distant cousin relationships across multiple generations within diaspora populations.
Historical records within this cluster also connect to known Iberian family lines dating from the sixteenth through eighteenth centuries, including individuals documented in Portugal, Spain, Puerto Rico, and colonial New Spain.
Mediterranean Transitional Cluster
Between the Levant and Iberian clusters sits a smaller but important group of Mediterranean matches associated with Italian and Adriatic surnames such as Simoni, Maestri, Paroli, and Ancona. These surnames appear at autosomal levels ranging between 8 and 18 centimorgans.
Although smaller in number, this cluster represents approximately:
10–12% of the autosomal dataset, and serves as a geographic bridge connecting eastern and western Mediterranean populations.
Northern European Simonis Cluster
The Northern European cluster centers around the Simonis surname itself and related Simon-derived forms such as Simons and Simonson. Autosomal matches connected to this cluster appear at some of the highest centimorgan levels within the dataset.
Several matches exceed 50 centimorgans, including values above 56 cM and 52 cM, with additional matches in the 40–50 cM range.
Matches at these levels typically correspond to relationships within roughly the fourth cousin range or closer, indicating that the Simonis surname network remains a strong and recent component of the genetic dataset.
Across the autosomal registry, the Simonis surname cluster accounts for approximately:
20–22% of the total autosomal matches examined in this study.
These matches also align with historical records documenting the Simonis family in the Low Countries and surrounding regions beginning in the late sixteenth and seventeenth centuries.
Overall Dataset Distribution
When the entire dataset is analyzed by geographic surname clusters, the approximate distribution appears as follows:
Levant surnames and clusters: 28–32%Iberian and Atlantic surnames: 33–38%Mediterranean transitional surnames: 10–12%Northern European Simon-derived surnames: 20–22%
This distribution demonstrates that the Simonis genetic environment is not confined to a single European population. Instead, the dataset forms a multi-regional network connecting eastern Mediterranean, western Mediterranean, and Northern European populations.
Convergence of Genetic Layers
The significance of this distribution lies not in any single match or surname, but in the alignment of multiple independent layers of evidence.
The paternal haplogroup structure places the Simonis lineage within a corridor that includes Levantine and Mediterranean branches of haplogroup I. The autosomal dataset reveals dense clusters of shared DNA among Levant surnames such as Taha and Srour. Additional clusters appear among Iberian diaspora families and Mediterranean populations. Finally, the Simonis surname emerges strongly within Northern Europe, supported by both modern autosomal matches and historical documentation.
Together these layers form a continuous genetic corridor that stretches from the Levant through the Mediterranean world and into Northern Europe. Within this corridor, the Simonis surname appears as one branch of a much broader ancestral network associated with the name tradition of Simon and Simeon.
This convergence of paternal lineage, autosomal clustering, surname continuity, and historical records forms the structural foundation for what has been described in this research as the Simeonite Spine—a lineage network extending across the Mediterranean and European worlds and preserved in the modern Simonis family line.
Final Convergence: The Spine of the Simonis Line
When the entire body of evidence is examined together, the result is not a single genetic clue or an isolated surname connection but a convergence of independent lines of data pointing in the same direction. The paternal backbone of the Simonis line sits within the I-Z140 trunk and the I-CTS10937 corridor, a branch that appears repeatedly across Mediterranean populations. Within that same haplogroup environment, Simon-derived surnames such as Simonis, Simons, and Simoni appear alongside Levantine family names and Mediterranean diaspora surnames. Autosomal DNA reinforces this structure by revealing a dense Levant cluster—most visibly through the Taha network, where dozens of matches span the full spectrum of shared DNA from small background segments to large segments exceeding forty centimorgans. Parallel clusters appear in Iberian surname networks connected to the Portuguese and Spanish diaspora, while high-level autosomal matches confirm the continuity of the Simonis surname network in Northern Europe. Each layer—Y-DNA structure, autosomal density, surname continuity, and historical records—points to the same geographic pathway: Levant origins, Mediterranean movement, Iberian diaspora expansion, and Northern European establishment. When these independent layers converge, they form a coherent lineage corridor rather than a coincidence of unrelated signals. In this context the Simonis line emerges as a visible branch within a much older name tradition carried through the Mediterranean world under the name Simon or Simeon. The alignment of haplogroup structure, autosomal clustering, and historical surname continuity reveals what this research has described throughout the study: a genetic and historical backbone linking the Simonis family to a long-range Mediterranean diaspora lineage—the structure identified here as the Simeonite Spine.
Sources and Research References
The following sources provide background material for the genetic, historical, and genealogical evidence discussed in this study. These references help explain Y-DNA haplogroup structure, STR marker behavior, and the presence of Haplogroup I within Jewish populations.
STR Marker Studies and Mutation Behavior
STR Mutation Patterns in Y-Chromosome Lineages
This peer-reviewed scientific paper examines mutation patterns in short tandem repeat (STR) markers on the Y-chromosome, which are widely used in genetic genealogy and population genetics. STR markers mutate faster than SNP markers and can produce distinctive haplotype patterns that help identify lineage clusters and estimate the time to a most recent common ancestor (TMRCA).
Studies like this explain how rare STR values—such as the DYS455 = 8 mutation discussed in this study—can emerge within a lineage and persist for many generations, forming recognizable cluster signatures within specific branches of the Y-chromosome tree.
Understanding STR mutation behavior is essential when interpreting extended STR panels and comparing paternal lineages across populations.
J2b DYS455 = 8 Project
This research project documents a rare STR mutation where the marker DYS455 drops to the value 8 within a cluster of Ashkenazi families belonging to Haplogroup J2b. The study demonstrates how rare STR mutations can define founder lineages that expand across multiple surnames. Although this cluster belongs to Haplogroup J rather than Haplogroup I, it provides an example of how rare STR mutations can become stable identifiers within a lineage and persist across centuries.
Cizewski Y-DNA Jewish Cluster Dataset
Comparative context for the YCAII mutational cluster referenced above can be found in the Cizewski Male DNA Analysis, a genealogical Y-DNA study documenting paternal lineages associated with Jewish cluster signatures within Haplogroup J1 (P58+). The dataset identifies a group of closely related paternal lines classified as “Jewish Cluster B,” where members share the defining SNP structure J1c3d, P58+, L147+* along with recurring STR configurations that include YCAII values such as 19-22, 21-22, and 22-22. These profiles appear among individuals of known Jewish ancestry from Eastern Europe as well as populations historically connected to Mediterranean Jewish communities.
Within this documented cluster framework, the recurrence of closely related YCAII values illustrates how STR markers can form identifiable mutational groupings across related paternal lines. The 19-21 value observed in the Simonis haplotype sits directly within this same mutational cluster, positioned between several of the values documented in the Cizewski dataset. Because STR mutations commonly occur through single-step repeat changes, the relationship between these values provides a comparative reference for understanding the placement of the Simonis STR profile within broader Mediterranean and Jewish STR patterns.
The Cizewski study also illustrates the historical context in which these genetic signatures appear. The research traces paternal matches between the Cizewski family and Jewish families such as the Ewenczyk lineage, identifying a shared paternal ancestor approximately 17 generations ago (around the late sixteenth century) based on STR mutation analysis and genealogical reconstruction. This example demonstrates how STR cluster patterns can persist within lineages connected to Jewish diaspora populations across Eastern Europe and the Mediterranean world.
Source:Cizewski, Leonard H., and Daniel Ewenczyk. Cizewski Male DNA Analysis.Available at: https://www.ibiblio.org/cizewski/dna/cizewski.html
Jewish Haplogroup I Research
Jewish DNA – Haplogroup I Overview
This page documents the presence of Haplogroup I lineages within Jewish populations, particularly within Ashkenazi communities. While Haplogroup I is often associated with European populations in general population studies, Jewish DNA research has identified several clusters of Jewish families belonging to this haplogroup. These findings demonstrate that Haplogroup I paternal lines can appear within Jewish genealogical contexts.
Ashkenazi Genetic Background
Ashkenazi Jewish DNA FAQ
This resource explains the genetic structure of Ashkenazi Jewish populations and describes how founder effects shaped their paternal lineages. The Ashkenazi population expanded from a relatively small number of ancestral families during the medieval period, producing identifiable Y-DNA clusters across several haplogroups including J1, J2, E1b1b, R1a, G, and I.
Understanding these founder effects helps explain why specific paternal lineages appear repeatedly within Ashkenazi genealogical datasets.
Haplogroup I Clusters within Ashkenazi Populations
Ashkenazi Haplogroup I Clusters
This research compilation examines the presence of Haplogroup I branches within Ashkenazi Jewish populations, identifying several clusters that appear in Y-DNA testing projects. These clusters demonstrate that paternal lines within the I-haplogroup tree can be integrated into the broader Ashkenazi genetic landscape.
Interpreting Genetic Evidence
The sources above illustrate several key principles used in this research:
Genetic lineages must be interpreted through multiple layers of evidence, including SNP-defined haplogroups, STR marker patterns, autosomal DNA matches, and historical records.
Rare STR mutations such as DYS455 = 8 can help identify cluster relationships but must always be considered alongside deeper SNP-defined haplogroup branches.
Jewish populations historically contain multiple paternal haplogroups, and founder effects within Ashkenazi communities produced recognizable clusters across several Y-chromosome branches.
Taken together, these studies provide the broader genetic context for examining the Simonis paternal lineage within a Mediterranean and Jewish diaspora framework.
Jewish Y-Chromosome Population Structure
Hammer, M. F., et al. (2000). Jewish and Middle Eastern non-Jewish populations share a common pool of Y-chromosome biallelic haplotypes. Proceedings of the National Academy of Sciences (PNAS).https://www.pnas.org/doi/10.1073/pnas.100115997
This landmark population genetics study analyzed Y-chromosome haplotypes among multiple Jewish communities and neighboring Middle Eastern populations. The results showed that many Jewish paternal lineages share a common ancestral pool originating in the Near East, despite thousands of years of geographic dispersal. The study provides broader genetic context for understanding how Jewish paternal lineages appear across multiple regions while retaining links to a shared ancestral source population.
Ashkenazi Levite R1a-Y2619 Founder Cluster
Behar, D. M., et al. (2017). The genetic variation in Ashkenazi Levites’ Y chromosome reveals a recent founder event.https://pmc.ncbi.nlm.nih.gov/articles/PMC5668307/
This peer-reviewed genetic study examines the Y-chromosome structure of Ashkenazi Levite lineages and identifies a major founder cluster belonging to R1a-Y2619. The research shows that a large proportion of Ashkenazi Levites descend from a single paternal ancestor who lived approximately 1,700–1,800 years ago. The dataset provides extended STR haplotypes and modal marker ranges for this lineage, allowing comparison with other Y-DNA profiles.
The modal STR ranges reported for this lineage include values that appear within the Simonis Panels 2–3 marker structure, including markers such as DYS458, DYS448, DYS449, DYS456, DYS437, DYS438, DYS442, DYS570, DYS576, and DYS607. These ranges are used in this study strictly as comparative STR pattern references when examining the Simonis haplotype architecture.
Rootsi, S., et al. (2013). Phylogenetic applications of whole Y-chromosome sequences and
the Near Eastern origin of Ashkenazi Levites.https://pmc.ncbi.nlm.nih.gov/articles/PMC3905698/
This study reconstructs the phylogenetic history of the Ashkenazi Levite lineage within haplogroup R1a using SNP and STR data. The analysis supports a Near Eastern origin for the R1a-Y2619 lineage and provides supplementary STR datasets that document the modal values observed within this Jewish founder cluster.
The published STR data include ranges for markers such as DYS437, DYS438, DYS442, and related loci, which appear in comparable ranges within the Simonis STR panels.
Thomas, M. G., et al. (2000). Multiple origins of Ashkenazi Levites: Y-chromosome evidence for both Near Eastern and European ancestries.https://www.researchgate.net/publication/9885604_Multiple_Origins_of_Ashkenazi_Levites_Y_Chromosome_Evidence_for_Both_Near_Eastern_and_European_Ancestries
This early Y-chromosome study examines paternal lineages among Jewish priestly and Levite families. The research demonstrates that Jewish populations contain multiple paternal haplogroups and provides foundational STR datasets used in later analyses of Jewish founder lineages.
Behar, D. M., et al. (2009). Extended Y-chromosome haplotypes resolve multiple and unique lineages of the Jewish priesthood. Human Genetics.https://www.researchgate.net/publication/26730731_Extended_Y_chromosome_haplotypes_resolve_multiple_and_unique_lineages_of_the_Jewish_priesthood
This study analyzes extended STR haplotypes among Jewish paternal lineages and documents modal marker patterns used to identify priestly and Levite clusters. The research provides additional comparative STR ranges used for evaluating haplotype structures across Jewish paternal datasets.
Ashkenazi Haplogroup G-M377 (G2c) Jewish Founder Lineage
Haplogroup G-M377 (Ashkenazi cluster)https://en.wikipedia.org/wiki/Haplogroup_G-M377
Haplogroup G-M377 represents a well-known Ashkenazi Jewish paternal lineage that expanded within Jewish populations during the medieval period. Genetic studies show that this lineage forms a recognizable founder cluster and contains distinctive STR modal patterns documented in Jewish Y-DNA projects.
The modal STR configuration for this lineage includes the marker DYS459 = 8-9, which also appears in the Simonis Panel 2 STR structure. This marker configuration provides an additional comparative reference when examining the Simonis STR architecture alongside documented Jewish lineage datasets.
Jewish DNA Haplogroup Cataloguehttps://jewishdna.net
This resource compiles Y-DNA haplogroup branches documented within Jewish populations and provides modal STR profiles used for genealogical comparison. The catalogue includes datasets for several Jewish paternal haplogroups including J1, J2, G, R1a, E, and I, illustrating the diversity of paternal lineages present within Jewish diaspora populations.
Supporting STR Marker Reference
List of DYS Markershttps://www.chemeurope.com/en/encyclopedia/List_of_DYS_markers.html
This reference explains the structure and naming of Y-chromosome STR markers commonly used in genetic genealogy. The resource provides definitions for markers such as DYS458, DYS448, DYS449, DYS437, DYS438, and others discussed in the Simonis STR panel analysis.
Context Within the Study
The sources above provide the documented STR datasets used for cross-haplogroup pattern comparisons within this research. Jewish populations historically contain paternal lineages from multiple haplogroups, including J1, J2, G, R1a, E, and I. Because these populations share historical roots in the Near East and Mediterranean world, several STR marker ranges recur across these lineages.
In this study, these datasets are used strictly for comparative analysis of STR value ranges when examining the Simonis paternal haplotype structure.


Comments